How hot is the silver market? In the past 14 months, the Silver to Gold Ratio has been cut in half!
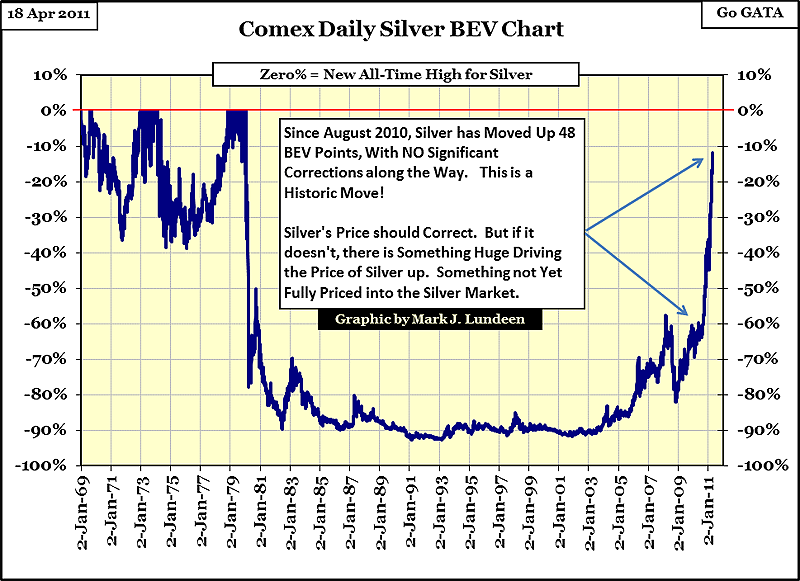
Looking at Silver's 1969-2011's Bear's Eye View (BEV) Chart below, we see the history of silver from 1969 to present. From 1969 to 1980, the largest correction in the price of silver was just short of 40%. This is a big decline in the Dow Jones, but something to be expected in Silver. After 1980, silver crashed down 92% by 1992, and for the most part, stayed there for the next 12 years.
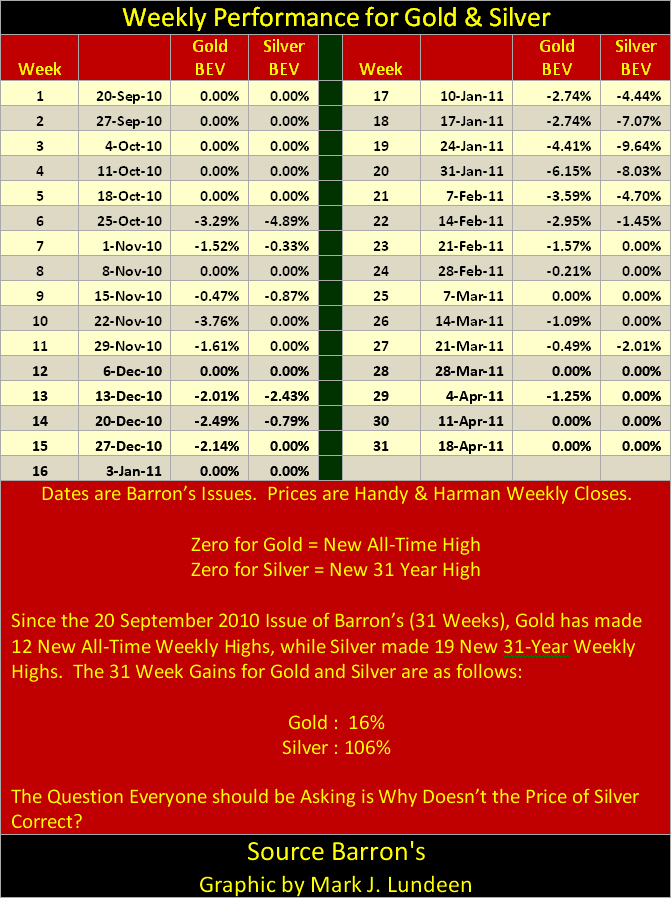
As this BEV Plot uses 17 January 1980 for its last all-time high, the March-October 2008 decline shows a loss of 25%. But that loss is in reference to Silver's last all-time high from 28 years before, where investors in 2008 actually saw a seven month loss of 58% ($20.69 to $8.79 Ouch!). Silver does that occasionally to those who buy it, or so it use to. Since May 2010, when Silver's BEV Plot broke above its 60% line, the largest correction in the price of silver (daily basis) has been less than 15% (January, 2011). Using a weekly closing basis (table below), silver has only corrected by 9.64%.

Also remarkable, silver has made a new 31-year high in 19 (61%) of its past 31 weekly closes!
The table below uses the Bear's Eye View (BEV Plot starting in late 1980, to eliminate the January 1980 highs) for gold and silver prices, with new highs (all-time for gold, and 31-year for silver) resulting in a Zero percentage, all weekly closing prices * not * a new high returns a negative percentage * from * its latest high.

The current phase in silver's bull market is extraordinary, driving silver up 106% in just 31 weeks. This is not happening in a vacuum! One day, we will all wake up to a new financial crisis, with the silver market getting coverage it has not seen since the Hunt Brothers crisis in January 1980.
Looking at Silver's 1969-2011's Bear's Eye View (BEV) Chart below, we see the history of silver from 1969 to present. From 1969 to 1980, the largest correction in the price of silver was just short of 40%. This is a big decline in the Dow Jones, but something to be expected in Silver. After 1980, silver crashed down 92% by 1992, and for the most part, stayed there for the next 12 years.
As this BEV Plot uses 17 January 1980 for its last all-time high, the March-October 2008 decline shows a loss of 25%. But that loss is in reference to Silver's last all-time high from 28 years before, where investors in 2008 actually saw a seven month loss of 58% ($20.69 to $8.79 Ouch!). Silver does that occasionally to those who buy it, or so it use to. Since May 2010, when Silver's BEV Plot broke above its 60% line, the largest correction in the price of silver (daily basis) has been less than 15% (January, 2011). Using a weekly closing basis (table below), silver has only corrected by 9.64%.

Also remarkable, silver has made a new 31-year high in 19 (61%) of its past 31 weekly closes!
The table below uses the Bear's Eye View (BEV Plot starting in late 1980, to eliminate the January 1980 highs) for gold and silver prices, with new highs (all-time for gold, and 31-year for silver) resulting in a Zero percentage, all weekly closing prices * not * a new high returns a negative percentage * from * its latest high.

The current phase in silver's bull market is extraordinary, driving silver up 106% in just 31 weeks. This is not happening in a vacuum! One day, we will all wake up to a new financial crisis, with the silver market getting coverage it has not seen since the Hunt Brothers crisis in January 1980.
No comments:
Post a Comment