Gold is a metallic element with the atomic number 79 and the symbol Au. While the name gold comes from an Old English word meaning yellow, the symbol comes from the Latin aurum, which means “shining dawn.”
On the periodic table of elements, gold is found in Group 11, along with silver, copper, and roentgenium, and in Period 6 between platinum and mercury. It is referred to as a “transition metal.” Gold is the most malleable, ductile metal. Described as yellow, gold is one of the so-called precious metals, along with gold and silver.
Known from ancient times — along with mercury, sulfur, copper, silver, lead, and tin — gold was used as early as 6000 B.C. Early use included gold jewelry, for example bracelets and rings, as well as ornamentation. Its malleability means that its early use in any practical items was impossible, so its used was restricted to decoration. The civilizations that employed it included the Egyptians, the Greeks, the Mesopotamians, and the Romans.
Gold is found in both lode deposits and placer deposits, and is naturally uncombined. While the largest deposit is to be found in South Africa, deposits of note are also located in Australia, the former Soviet Union, and a number of western states of the United States, including Arizona in the Southwest; California, Montana, and Washington in the Pacific Northwest, and South Dakota in the Midwest.
Although many people many know gold for its use in jewelry — which is how about 65 percent of it is used, gold has a number of other uses. About 25 percent of gold is used in industrial applications in ceramics, electrical, and electronics applications.
Kitco Forum for gold, platinum, silver & base metal discussion gold,silver,platinum,paladium,copper,zinc,uranium,aluminium,lead,rhodium
Wednesday, January 12, 2011
targets charts for 2011
Je ne suis ni courtier ni conseiller. Tout ce qui est publié dans ce blog ne saurait être considéré autrement qu'à titre de suggestion. Il vous appartiendra toujours de procéder à vos propres recherches avant de prendre une décision.
I am neither a broker nor a counsellor. All that is published in this blog may not be construed as anything else than a suggestion. It will always remain your responsability to do your own research before taking any decision.
I am neither a broker nor a counsellor. All that is published in this blog may not be construed as anything else than a suggestion. It will always remain your responsability to do your own research before taking any decision.
TARGETS / CIBLES
Mes cibles pour le 31 décembre 2011, d'une méthode essentiellement technique.
La présente page a été publiée initialement le 2 janvier 2011 et aucune modification ne sera apportée aux graphiques avant la fin de 2011.
My targets for Decmeber 31, 2011, essentially from a technical stand-point.
This page has been initially published Jan. 2, 2011 and the charts will not be modified until year year's end.
Saturday, January 8, 2011
The Falling Dollar And Debt Drives Gold And Silver
The Falling Dollar And Debt Drives Gold And Silver
Rolf Nef
Tell Gold & Silver Fund
6 January 2011
Tell Gold & Silver Fund
6 January 2011
Since August 1971 the US dollar drops in a cycle that created every 8th year a bottom. The first three bottoms - 1979, 1987 and 1995 - are very clear visible, a bit less so the one in 2003. If the dollar follows this cycle, 2011 should be another year with a dollar bottom.
The drop from 1971 to 1979 was much faster than the following downtrend, but which could accelerate again, once the lower trendlines will be broken. The next line (see next graph) is just below the current price followed by another one at 07.8. The lowest one is at around 0.55 to the Swiss Franc, roughly 40% lower.
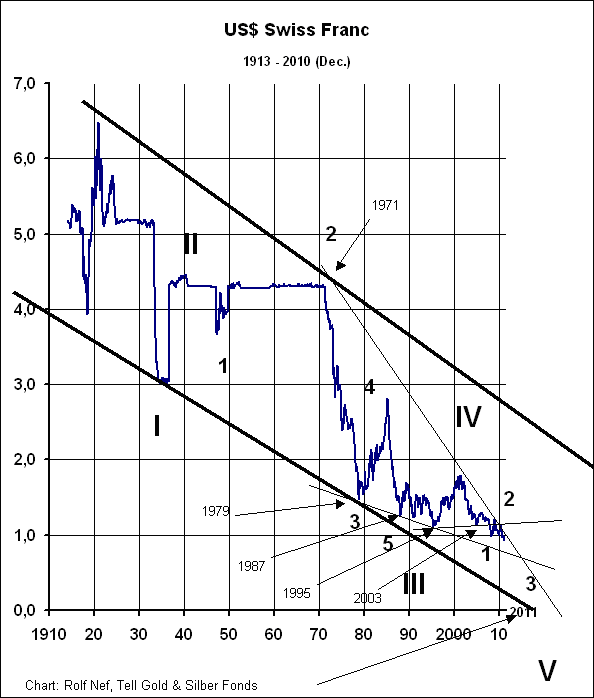
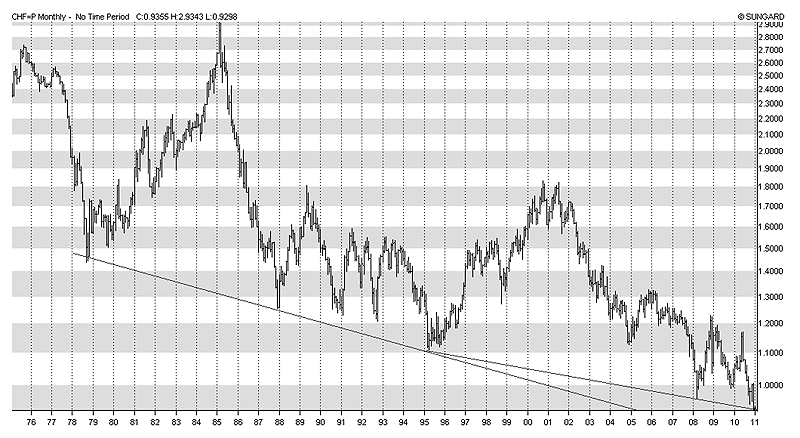
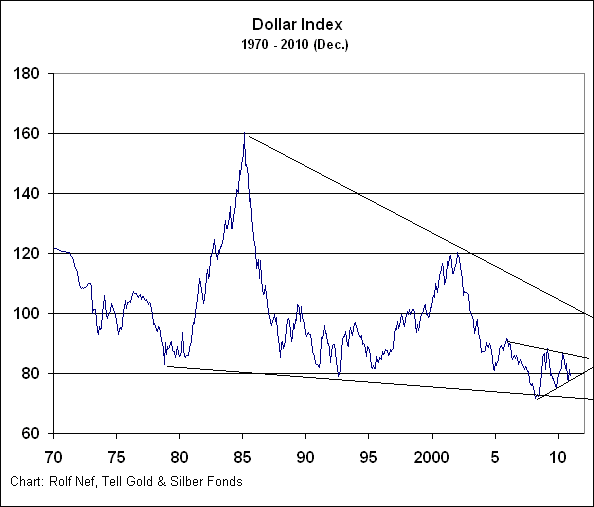
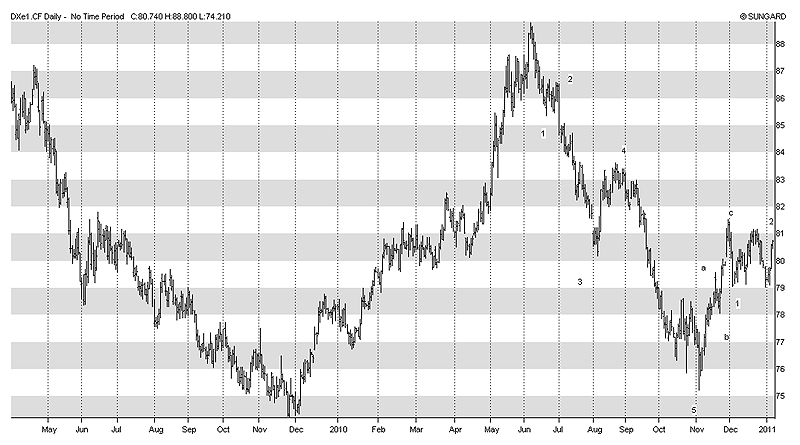
The chart of the Swiss Franc to the dollar does show a long history what helps to analyse, but economically it is not significant. A better indicator for that is the dollar-index, weighted with participation at the US foreign trade of each currency. But also this chart indicates, that the US currency will break to the down side. One the one hand side got the lower trendline already three times touched and on the other hand side exist a triangle since 2005, which upper and lower trendline got both already three times touched. A decision will fall soon and most likely to the downside, as the last downleg as shown on the daily short term chart from June to November was impulsive, followed by only one month correction.
The formation from 1992 can also be looked at as a head-shoulder with the head in 2001. The distance from the head to the neckline, which is at 80, is 40 and points - deducted from the neckline to the downside - to 40!! Such a move in this year would be a dollar panic. Also one has to put into consideration, that the break through the neckline and the retracement has already happened. Technically the market is very ready for such a move. Is something like that possible and what would be the economic background?
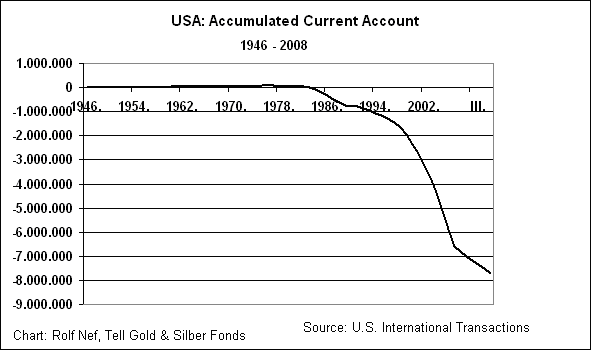
Since the US balance of payment became negative (e.g. negative trade balance, negative current account and negative balance on capital income), 9'000 bio $ have piled up in foreign hands, mainly in Asia. That's a long position and still growing as long as buyers can be found. But these holder could reduce their dollar position and sell partly. Most likely that would lead to a panic, a fast drop. Therefore it is not surprising we see such a heavy propaganda against the Euro. It seems the last weapon for the unavoidable.
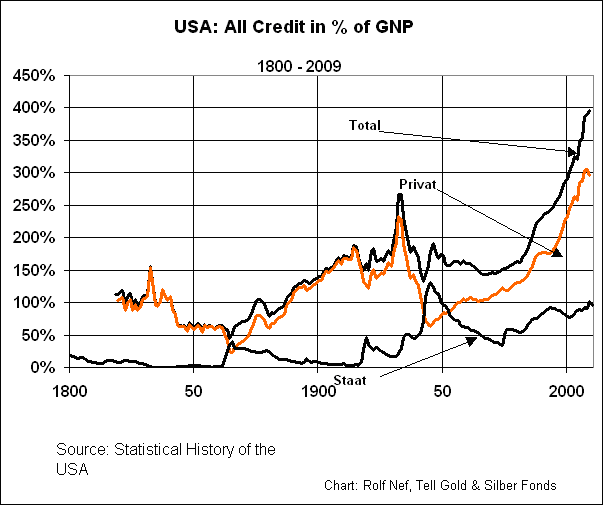
That this scenario has a high probability is also due to the fact, that the US economy will not start being very active again. The main reason is the too high debt burden on the private sector. This sector will not start building new debt and becoming economically active. To the contrary, it tries to reduce the debt load.
Gold and Silver
For the dollar we have only a yearly cycle that points for 2011 as a bottom year. For gold we get more precise cycles also for 2011, but pointing for specific months.
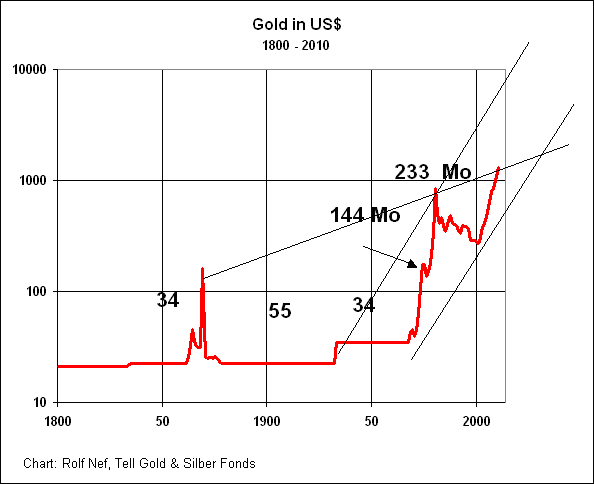
Since the gold bull started in 1835, all bull and bear phases until 1968 happened in exact yearly Fibonacci numbers. From 1968 on the market got faster and switched to monthly figures:
- March 1968 to January 1990: 142 months (closed to 144).
- January 1990 to August 1999: 235 months (closed to 233).
- August 1999 plus 144 months would be August 2011.
- October 2006 (end wave 4) plus 55 months would be May 2011.
- June 2003 (start silver bull) plus 8 years point to June 2011.
Where could the prices be? Look at the lower graph with the three simple trendlines. On the one hand side form the two parallel ones (1934 - 1980 and 1968 - 1999) the channel since 1934. It would be only normal to reach the upper trendline, but which is around $7,000! Even that is very hard to imagine this year -- and I am not willing to do a forecast, the line is still up there. But one has to know that and take into consideration and not rule out as impossible.
On the other hand side forms the trendline from the top in 1869 connected with the top in 1980 the upper line of a rising wedge. Rising wedges are normally negative and drop to the downside, but in commodities very often they go the other way round and are very powerful. I think this is the case here.
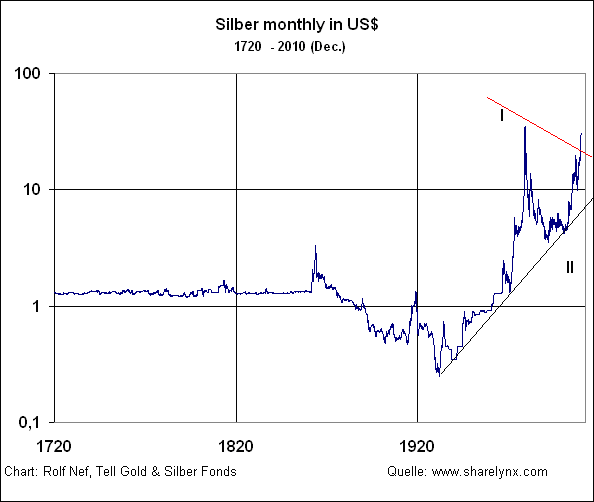
More clearer than gold shows the silver chart, that it is in the second upleg of its bull move that started in 1932. Before the third upleg can start, a correction must lie in between, but this will start much higher up, as the high of 1980 is even not yet surpassed, as it is the case with must commodities. And even despite the fact that there is less silver around than in 1980 and much less than in 1900. Today the amount of silver stock is only about 1 bio oz but was 12 bio oz in 1900!! That's why the silver market is only about 1% of the gold market or 30 bio $ relative to 3000 bio $. But it used to be about 30 - 40%.
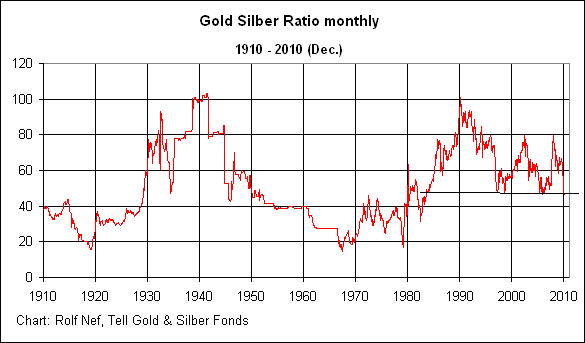
Even here the technicals point to an explosive future of the silver market. During the fast move from September 2010, the market produced not one gap. This phase is still ahead of us. Despite the scarcity of silver, its relative price to gold is still 1:46 and therefore cheap. Will it fall clearly below 46, it will trade at a level no more reached since 27 years (1983). And something more you get out of this chart: when the gold bull started in March 1968, gold moved faster than gold as silver had its move before, the ratio was around 1:16. But also at the top in January 1980, the ratio was still at 1:16. But now, in front of the parabolic phase, the ratio is still 1:46.
That's why silver is so promising in that phase:
- Extreme scarcity with only 1% of the gold market and only 30 bio $ capitalization
- Short positions in the market
- No large government holdings
- Still cheap relative to gold
- Not yet any gap in the chart
The Princeton Cycle of Martin Armstrong
Because the dollar cycle points to 2011 as a bottom and the Fibonacci cycles for gold point to summer 2011 as a top, I would like to point your attention on the 8,6 year cycle of Martin Armstrong, which points for June 13th as a potential turn. How is that cycle calculated? Armstrong discovered this cycle - 8,6 years are exactly 1000 Phi days. Added to 1928,75, the exact date of the crash, or fractions of it as �, � and 1/8 you get dates which represent very significant market actions:
1987,8: the stock market crash in the US and most other countries.
1989,55: Nikkei top.
1998,55: top stockmarkets followed by the Asia crisis.
2002,85: end of US stockmarket bear from 2000.
2008,225: top commodities and dollar bottom.
2011,45 ?? (also nothing is possible).
All three cycles - each independent from the other - deliver no guarantee - but raise the probability that gold and silver will interrupt the bull move to complete the middle leg. After a pause they will go on even more extreme. Such a final leg is always steep and explosive. The fundamentals will confirm the rising market: bankruptcies and a falling dollar.
********
The Strategy of the Tell Gold & Silver Fund
It has been the strategy of the "Tell Gold & Silver Fund" from the beginning on to target the parabolic phase of the silver market. Because it is so cheap and scarce, this phase must become above average what has happened until now in history. As this phase is still ahead of us and probably closed, the fund keeps a large position of silver call options and the rest in physical. The leverage with options avoids a margin call during hefty corrections or interventions. But the fund can also reverse its position to short or to 100% cash.
How High Can Stocks Go?

How High Can Stocks Go?
7 January 2011
While this analysis is based on the S&P 500 Index, it indirectly applies to all economic expansion and inflation-protection assets, such as copper, oil, silver, and gold. If stocks are making higher highs, inflation-protection assets will most likely come along for the ride.
We study the S&P 500 since it remains the most widely-accepted vehicle to monitor market participants' acceptance of or aversion to risk. Similarly, the S&P 500 helps us monitor the ongoing battle between global inflationary and deflationary forces. When money printing and economic expansion rule the day, the S&P 500 tends to be healthy. When excessive levels of global debt, unfunded entitlements, bloated housing inventories, and economic weakness are front and center, the S&P 500 tends to be weak.
As we outlined in our 2011 Investment Outlook, the S&P 500 recently cleared several key levels, which leaves the door open to the possibility of higher highs in stocks. This analysis looks at market levels that piqued the interest of both buyers and sellers between 1998 and 2011. We studied weekly and monthly charts looking at intra-day highs and lows, as well as closing prices. The table below summarizes the results, focusing on market levels that have the highest probability of impacting asset prices.
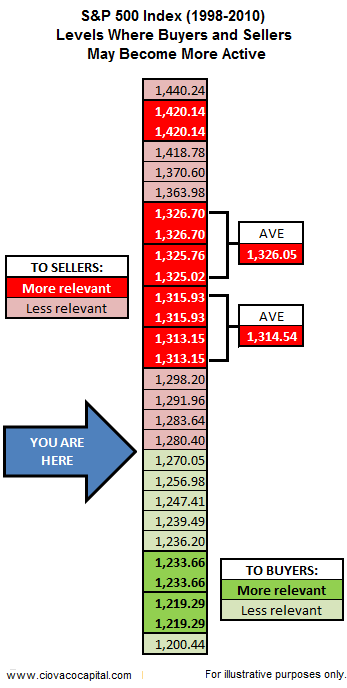
The chart below highlights important levels from a monthly perspective. There are numerous ways to determine possible areas of support and resistance. Therefore, other levels may, and most likely will, come into play over the coming months.
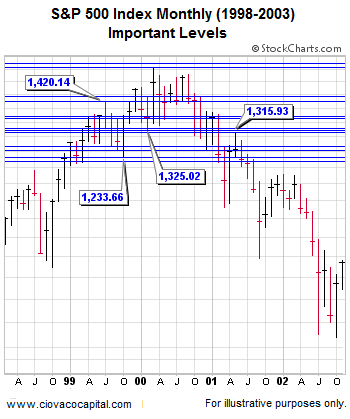
The same concept is presented below with a different time frame. Notice on the right side of the chart, the present day market may have some more room to run in terms of the most relevant levels of resistance.
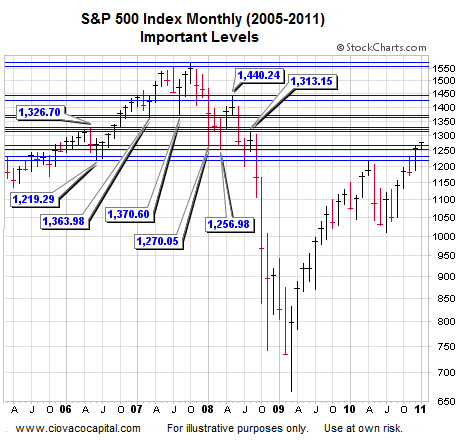
The following charts are weekly charts identifying key S&P 500 levels in a little more detail than shown in the summary table above. If you bookmark this article, it may be helpful to check back from time-to-time as the market advances or declines.
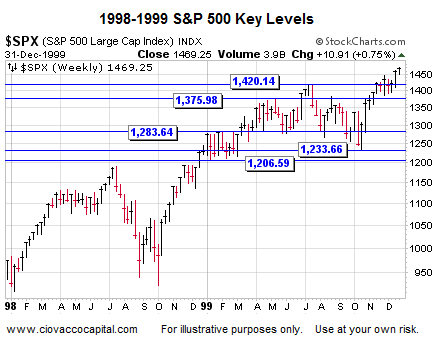
While not all that important since they marked relatively short reversals, the S&P 500 does have to contend with 1,275.09 and 1,279.64 in the short-run (see below).
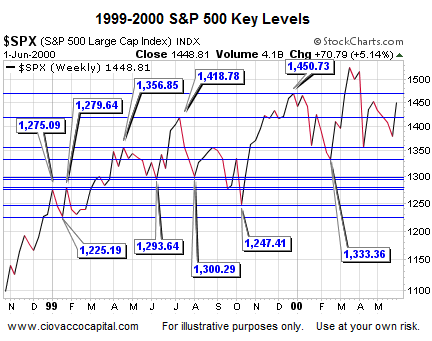
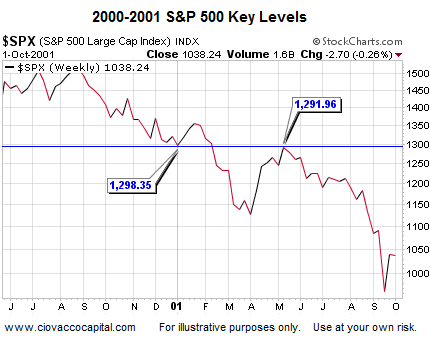
The chart above looks at closing prices. The chart below is based on intra-day highs and lows. All three are relevant to market participants.
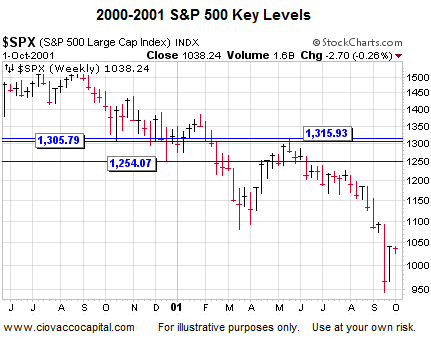
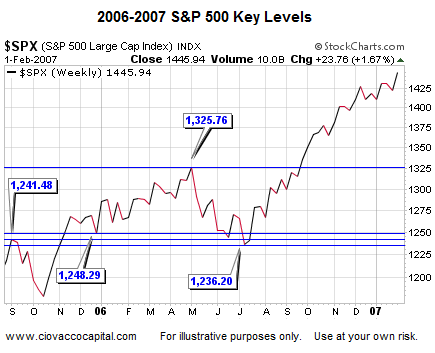
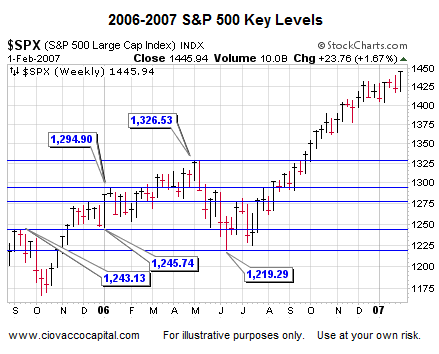
The analysis above can help both bulls and bears alike since it identifies areas of possible support should market participants begin to refocus their attention on the deflationary side of the coin. The market's upside potential, even under positive circumstances, may not be met until some form of corrective activity or consolidation takes place. Bullish sentiment needs to be monitored and remains a yellow flag for the markets.
The S&P 500 & Gold Under Pressure on Friday
With the holiday season in the rear view mirror and volume slowly creeping back into the marketplace, I can't help but wonder what lies ahead. The optimist in me is hopeful that the economy will continue to repair itself and the financial issues that plague the federal government, state government, and local governments will just go away as the economy rebounds. The only problem with my hope is that massive debts and deficits do not simply disappear and I fear the problem will be a long and lasting one.
Federal Reserve chairman Ben Bernanke indicated that unemployment numbers are likely to remain stubbornly high for an extended period of time. He also made it clear that Quantitative Easing II was necessary and needed to be continued in a vain attempt to keep interest rates low. Since its inception, treasury rates have done nothing but increase which begs the question whether the program is really doing anything it was intended to do.
In addition to our domestic debt issues, unemployment claims, and poor housing market we find that the crisis in Europe while somewhat muted, continues to manifest in a negative fashion. Nearly every where we look we are surrounded by fundamental issues which directly impact risk assets. These issues have been constant for quite some time and the S&P 500 has shrugged them off and powered higher. The S&P 500 has put on quite a run since the March 2009 lows, and while we have had several corrections and a "flash crash" along the way, we have yet to see a major correction turn into bearish market conditions.
Is price action today an early warning sign that lower prices await us in the equities market. Is the U.S. Dollar going to breakout above the 50 period moving average and challenge the 83 price level on the weekly chart?
LBMA Survey: Gold Prices To Average $1,457 Per Ounce In 2011
(Kitco News) - Gold prices are forecast to average $1,457 an ounce during 2011, a 19% increase over the 2010 average, according to an annual survey of analysts released by the London Bullion Market Association Friday.
Analysts collectively predicted silver will average $29.88 an ounce, which would be a 48% increase on the 2010 average price.
The 2011 average platinum price was forecast at $1,813, a rise of 12.6% from the 2010 average. For palladium, the 2011 prediction was $814.65, a 54.8% increase from the 2010 average.
Twenty-four analysts took part in the LBMA survey, listing their estimates for the high, low and average prices for the precious metals in 2011, based on London fixings.
The average gold forecast of $1,457 is in line with the forecast of $1,450 made by delegates to the 2010 LBMA Precious Metals Conference held in Berlin in September.
For gold, the average 2011 high forecast for the year was $1,632 and the average low was $1,268. The comparable figures for silver were $38.36 and $22.93.
For platinum, the average high forecast for the year was $2,015 and the average low was $1,598. The comparable figures for palladium were $993.35 and $631.17.
Default I Got my Scale !
Hello,
Through some great advice here I purchased my 1st scale to confirm 1 ounce gold coins. I did not realized that gold is measured by "troy" ounces which less than a US ounce! Still learning about this stuff. I've got all the different weights for a one troy ounce.
1 troy ounce of gold.
1.10 US ounce,
31.10 grams,
480 grains and
155.5 carrots.
Question: How much does the weights in all measurements have to be off before I start questioning if the gold coin is a fake? I would not what to falsely
tell a seller a one ounce coin is counterfeit, when it might not be.
Thank you in advance!
Nehemiah
Jim Sinclair's $1650 By 1-14-2011 Tribute Thread
With this board being the Internet's most popular gold forum, I feel it's appropriate to honor Jim Sinclair's decade long prediction that spot gold will trade at $1650 on or before January 14th, 2011 so that members can add their congratulations when that number is achieved some time before next Friday's close.
The price is currently just $280 away from the target number which equates to a rise of less than 21% for his magnum opus call to hit.
Uncle Jim, as he is affectionately known by many, remained steadfast throughout 2010 when reaffirming his call at regular intervals. He always did so using statements that left no room for any ambiguity and they served to reassure his readers and admirers to retain their trust in him.
He stiffened their resolve once again a little over five weeks ago on December 2nd and by doing so his ten-year-old call became a six weeks one too. Those remarks and other recent ones are quoted and linked below.
December 2nd, 2010 - 'Be assured that the gold price will be looking back at all levels including $1,400, $1,500 and $1,600 in the very near future. http://jsmineset.com/2010/12/02/in-the-news-today-724/
September 7th, 2010 - 'I will stand with what I have said for nearly 10 years. Gold will trade at $1650 on or before January 14th, 2011.' http://jsmineset.com/2010/09/07/stra...-the-big-move/
July 27th, 2010 - 'The timing remains the same. Gold will trade at $1650 on or before January 14th 2011.' http://jsmineset.com/2010/07/27/jims-mailbox-497/
July 6th, 2010 - 'Gold is going to $1650 on or before January 14th, 2011.' http://jsmineset.com/2010/07/06/time-and-time-again/
June 8th, 2010 - I know for certainty that gold will trade at $1650 on or before Jan 14th, 2011. http://jsmineset.com/2010/06/08/in-the-news-today-566/
Alchemical Gold
A small thread for the few who may wish to discuss the esoteric side, that is to say, the alchemical and representational values of gold.
Two "starter" observations as 2011 unfolds:
(1) Owning gold is a beginning. The real gold, worthy of possession at any price, is an undivided mind. Which is simple enough: he or she who does not violate his or her conscience is a golden fellow. Others must go into denial, which is two-mindedness--insanity from the angelic point of view.
(2) I had figured that the early a.m. January 4th eclipse of the Sun would be favorable for gold, unfavorable for the dollar. Obviously I got it backwards (as I thought I might). It was a North Node eclipse in the second house (Washington D.C. reference place), exactly opposite the US Sun.
My question for anyone practicing the ancient art of cycles is, did I get the interpretation reversed because (a) the nodality (North Node) overrode the aspectuality (opposition to the Sun = dollars or gold), because (b) the eclipse ocurred in the U.S. second house (presumably dollar positive on a North Node eclipse), or (c) for some other reason?
Subscribe to:
Posts (Atom)


