Gold prices held onto gains of nearly 1% on Friday, achieved after weak US nonfarm payrolls data renewed fears about the health of the world's biggest economy and spurred safe-haven buying.
Spot gold rose to a two-week high of USD 1,545.30 an ounce, and steadied around USD 1,540.75 by 1:21 pm EDT (1721 GMT) against USD 1,531.85 late in New York on Thursday.
US gold futures for August delivery rose USD 10.90 to USD 1,541.50, having reached a two-week high at USD 1,546.
Employers in June added the smallest number of new jobs in nine months, dashing hopes of a pick-up in economic recovery. Nonfarm payrolls rose by 18,000, the Labor Department said, well below economists' expectations for a 90,000 rise.
"It is the public-sector employment which was the disappointing factor," said Peter Fertig, a metals consultant at Quantitative Commodity Research. "The market overreacted after yesterday's ADP report showed a strong increase in the private-sector payrolls.
"You have some safe-haven flows (into gold)," he said.
The dollar dropped against several currencies as the US jobs data strengthened expectations the Federal Reserve will leave interest rates low well into next year, prompting investors to embrace alternate safe-havens.
A weaker dollar often boosts dollar-denominated assets, such as gold, because of the advantage it provides buyers outside the United States.
Among other precious metals, silver hit a four-week peak at USD 36.82 an ounce, and remained higher around USD 36.51 against USD 36.41.
Spot platinum slipped to USD 1,729.99 an ounce from USD 1,739.85 on Thursday. Spot palladium was down at USD 775.47 an ounce against USD 781.55 previously.
The platinum:palladium ratio -- the number of ounces of palladium needed to buy an ounce of platinum -- held at its lowest in more than four months at 2.23.
Prices at 1:31 p.m. EDT (1731 GMT)
LAST/ NET PCT YTD
CLOSE CHG CHG CHG
US gold 1530.60 0.00 0.0% 7.7%
US silver 36.536 0.000 0.0% 18.1%
US platinum 1733.40 -9.60 -0.6% -2.5%
US palladium 786.55 0.00 0.0% -2.1%
Gold 1541.26 9.41 0.6% 8.6%
Silver 36.51 0.10 0.3% 18.3%
Platinum 1728.99 -10.86 -0.6% -2.2%
Palladium 774.47 -7.08 -0.9% -3.1%
Gold Fix 1541.50 15.50 1.0% 9.3%
Silver Fix 36.28 42.00 1.2% 18.4%
Platinum Fix 1740.00 5.00 0.3% 0.5%
Palladium Fix 776.00 6.00 0.8% -1.9%
Saturday, July 9, 2011
Avino Silver & Gold Mines
An Annual Report provides a detailed look at the financial results for the prior twelve months of operations. Reporting requirements vary by country, but almost every Annual Report will include:
- Chairman?s Statement
- Income Statement
- Cash Flow Statement
- Balance Sheet
- Notes to the Accounts
- Auditor?s Report.
Annual Reports may also include a marketing/product segmentation section, organizational charts and graphs.
Filing dates vary by country, as does the date by which the report must be filed by. For example, many U.S. and European companies have a year-end filing date of December 31, and their Annual Reports tend to be filed between April 1 and June 30. Japanese companies tend to file their report during the month of July, and Australian companies file starting September 15th.
We have history as far back as 1996 for the publicly traded companies in the database.
Financial filings from the Global Reports Library offer some significant benefits to researchers:
- Timeliness: Using web crawler technology, proprietary tracking systems and an experienced document acquisition team, we are able to update 90% of the documents in our collection on the same day they are made publicly available. For certain emerging market companies, it may take 3-5 days to source the document.
- Functionality: all the documents in our collection are in full-color native PDF format, meaning that documents are fully text searchable and can be copied/pasted into presentations and other documents Additionally, the native PDF format means that document sizes are quite small ? average <2.3 MB ? which allows for quick downloading.
- Quality: As the only Source Document collection in full color native PDF, Global Reports sets the standard for document quality. For customers needing high resolution in order to read financial figures or smaller font, Global Reports files are ideally suited.
Obtaining Annual Reports is fast, simple, and convenient via the Global Reports Library on Research and Markets. If you cannot find a specific Annual Report please notify us via our 'Contact Us' page.
Gold Prices 9 / 7 / 2011
Gold is presently experiencing an awakening as an investment category. The monetary world is in the moment long in concerns but short in answers. We think that gold is certainly one of the right answers in occasions of chronic doubt.
It's stated that trust is really a delicate flower; as soon as destroyed, it'll not return effortlessly. We think that the trust lost in the previous years won't be regained any time quickly, and that the scenario will really nonetheless get worse. The Eurozone is experiencing a breaking test, and also the US dollar is gradually sacrificing its status as the top international currency. Visit http://silver-dollar-values.com for a lot more silver coins and gold coins tips and ideas.
The international expansion of monetary supply ought to continue to provide gold investments with a good atmosphere.
The reaction to the present crisis is currently feeding in to the next crisis. Attempting to resolve a crisis using the very exact same instruments that brought on it (i.e. an large monetary policy) would appear to be grabbing at straws. The driving energies of wealth are savings as well as investments, not spending and debt. The weak US dollar is really a logical result of the quantitative loosening, which from our perspective is just a euphemism for stamping cash.
Offered that the vast majority of debt has not been written off nor paid off but merely transferred, the issue of excessive debt is nonetheless waiting to become resolved. There continues to be no deleveraging, only a realignment of booking records from the private to the public arena. The quantitative easing has still left monetary balance short on credibility, and it'll be very challenging to remedy this scenario.
In this fragile atmosphere gold will still thrive. Today is really a great time to add gold to your investment portfolio thru buying gold coins or gold bullion bars. Visit http://www.silver-dollar-values.com for a lot more silver coins and gold coins tips and ideas.
# # #
Silver Dollar Values is the premier coin price guide website for information on old coin values and silver dollar values, as well as gold prices, silver prices, silver bullion, gold bullion, gold coins and much more.
--- end ---
Saturday, April 23, 2011
Silver's Bull Market Summary
How hot is the silver market? In the past 14 months, the Silver to Gold Ratio has been cut in half!
Looking at Silver's 1969-2011's Bear's Eye View (BEV) Chart below, we see the history of silver from 1969 to present. From 1969 to 1980, the largest correction in the price of silver was just short of 40%. This is a big decline in the Dow Jones, but something to be expected in Silver. After 1980, silver crashed down 92% by 1992, and for the most part, stayed there for the next 12 years.
As this BEV Plot uses 17 January 1980 for its last all-time high, the March-October 2008 decline shows a loss of 25%. But that loss is in reference to Silver's last all-time high from 28 years before, where investors in 2008 actually saw a seven month loss of 58% ($20.69 to $8.79 Ouch!). Silver does that occasionally to those who buy it, or so it use to. Since May 2010, when Silver's BEV Plot broke above its 60% line, the largest correction in the price of silver (daily basis) has been less than 15% (January, 2011). Using a weekly closing basis (table below), silver has only corrected by 9.64%.
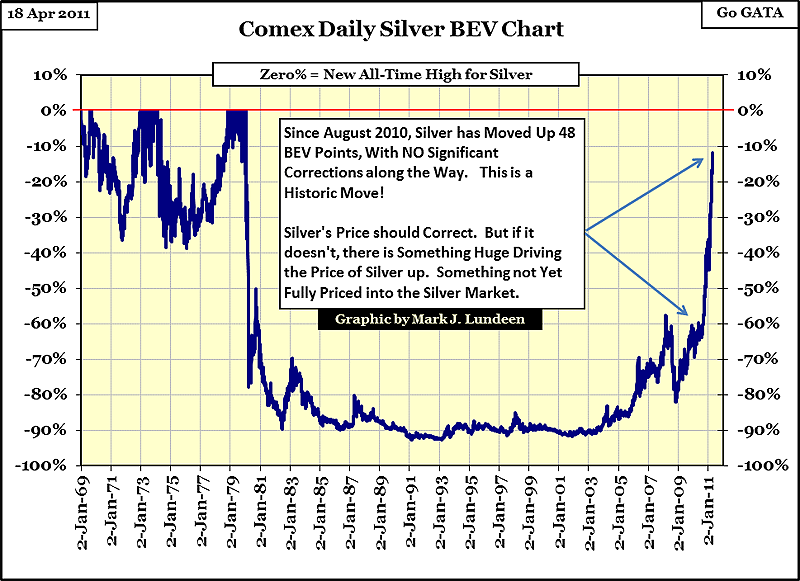
Also remarkable, silver has made a new 31-year high in 19 (61%) of its past 31 weekly closes!
The table below uses the Bear's Eye View (BEV Plot starting in late 1980, to eliminate the January 1980 highs) for gold and silver prices, with new highs (all-time for gold, and 31-year for silver) resulting in a Zero percentage, all weekly closing prices * not * a new high returns a negative percentage * from * its latest high.
The current phase in silver's bull market is extraordinary, driving silver up 106% in just 31 weeks. This is not happening in a vacuum! One day, we will all wake up to a new financial crisis, with the silver market getting coverage it has not seen since the Hunt Brothers crisis in January 1980.
Looking at Silver's 1969-2011's Bear's Eye View (BEV) Chart below, we see the history of silver from 1969 to present. From 1969 to 1980, the largest correction in the price of silver was just short of 40%. This is a big decline in the Dow Jones, but something to be expected in Silver. After 1980, silver crashed down 92% by 1992, and for the most part, stayed there for the next 12 years.
As this BEV Plot uses 17 January 1980 for its last all-time high, the March-October 2008 decline shows a loss of 25%. But that loss is in reference to Silver's last all-time high from 28 years before, where investors in 2008 actually saw a seven month loss of 58% ($20.69 to $8.79 Ouch!). Silver does that occasionally to those who buy it, or so it use to. Since May 2010, when Silver's BEV Plot broke above its 60% line, the largest correction in the price of silver (daily basis) has been less than 15% (January, 2011). Using a weekly closing basis (table below), silver has only corrected by 9.64%.
Also remarkable, silver has made a new 31-year high in 19 (61%) of its past 31 weekly closes!
The table below uses the Bear's Eye View (BEV Plot starting in late 1980, to eliminate the January 1980 highs) for gold and silver prices, with new highs (all-time for gold, and 31-year for silver) resulting in a Zero percentage, all weekly closing prices * not * a new high returns a negative percentage * from * its latest high.
The current phase in silver's bull market is extraordinary, driving silver up 106% in just 31 weeks. This is not happening in a vacuum! One day, we will all wake up to a new financial crisis, with the silver market getting coverage it has not seen since the Hunt Brothers crisis in January 1980.
50 Factors Launching Gold
Use the above link to subscribe to the paid research reports, which include coverage of critically important factors at work during the ongoing panicky attempt to sustain an unsustainable system burdened by numerous imbalances aggravated by global village forces. An historically unprecedented mess has been created by compromised central bankers and inept economic advisors, whose interference has irreversibly altered and damaged the world financial system, urgently pushed after the removed anchor of money to gold. Analysis features Gold, Crude Oil, USDollar, Treasury bonds, and inter-market dynamics with the US Economy and US Federal Reserve monetary policy.
Edification is not the word that comes to mind when observing an interview with Larry Fink of Blackstone this morning on network financial news. It was inspirational if not humorous, and somewhat pathetic. Of course the interviewer treated him like royalty, when just a syndicate captain, a Made Man. As a cog within the US financial hierarchy, he was asked why Gold is approaching record price levels near $1500 per ounce. He gave his best 10-second answer, showing no depth of comprehension but an excellent grip of propaganda laced with simplistic distortion. He said, "GOLD IS RISING FROM ALL THE GLOBAL INSTABILITY, AND NOT FROM INFLATION AT ALL." Sounds good, but it lacks much reflection of the world of reality burdened by complexity and interconnectivity that the enlightened perceive. At least he did not babble about Gold being in an asset bubble. It cannot, since Gold is money. It is curious that all the analysts, bankers, fund managers, corporate chieftains who did not advise on Gold investment over the last ten years are precisely whom the financial network news appeals to for guidance in the current monster Gold bull run. They knew nothing before, and they know nothing now. The major US news networks carry the Obama water while the USCongressional members carry the USBanker robes and show respect with genuflection before the priests. But guys like Fink are their harlot squires. Poor Ben Bernanke, despite his high priest position, does not gather a fraction of respect that Alan Greenspan did even though Alan presided over the collapse. The wild card possibly later this year or 2012 will be a national movement to force mandatory wage gains, and thus avert a national economic collapse. The squeeze is on in a powerful manner to both businesses and households.
ANOTHER STRONG GOLD BREAKOUT
As long as Quantitative Easing programs are in place and actively pursued, Gold & Silver prices will soar. The programs are urged by exploding budget deficits and absent USTBond demand. That translates to a ruined USDollar currency. Gold & Silver respond to the debasement and ruin. Efforts will become ridiculously stretched to save the USDollar, but will fail. QE will go global and secretive, assuring tremendous additional gains in the Gold & Silver price. No effort to liquidate the big USbanks will occur, thus assuring the process will continue until systemic breakdown then failure. The more extraordinary the measures to save the embattled insolvent fraudulent USDollar, the more the Gold & Silver price will soar. It is that simple. Gold & Silver will soar as long as central banks continue to put monetary inflation machinery to work. They are attempting to provide artificial but coordinated USTreasury Bond demand. In the process their efforts will continue to push the cost structure up further. In my view, since the Japan natural disaster hit with financial fallout, the Global QE is very much in effect, but not recognized as a global phenomenon. It pushes up Gold in uniform fashion worldwide.
50 FACTORS POWERING THE GOLD BULL
Introduction of a New Nordic Euro currency is near its introduction. The implementation with a Gold component will send Southern European banks into the abyss, marred by default. The new currency has the support from Russia and China, even the Persian Gulf. In my view, it is a USDollar killer. The first nations to institute a new monetary system for banks and commerce will be the survivors. The rest will slide into the darkness of the Third World.
Gold & Silver seem to be the only assets rising in price, an extension of a terrific 2010 decade. The exceptions are farmland and the US Stock market. However, stock valuations are propped by constant and admitted USGovt support. Their efforts are mere attempts to keep pace with the USDollar decline, as stocks merely maintain a constant purchase power.
A hidden overarching hand seeks the global Gold Standard as the bonafide solution. Darwin is at work, but Adam Smith turns a new chapter. The crumbling monetary solution demands a solution. Further investment in the current system assures a devastating decline into the abyss of insolvency and ruin.
THE HAT TRICK LETTER PROFITS IN THE CURRENT CRISIS.
From subscribers and readers:
At least 30 recently on correct forecasts regarding the bailout parade, numerous nationalization deals such as for Fannie Mae and the grand Mortgage Rescue.
"I look forward to your newsletter more than all the rest each month as you seem to have the best grasp of what is going on."
(ScottN in Washington)
"When I initially read your writings, they provoked a wide range of emotions in me from fear and anger to outright laughter. Initially some of your predictions ranged from the ridiculous to impossible. Yet time and again, over the past five years, I have watched with incredulity as they came true. Your analysis contains cogent analysis that benefits from a solid network of private contacts coupled with your scouring of the internet for information."
(PaulM in Missouri)
"Your analysis is absolutely superior to anything available out there. Like no other publication, yours places a premium on telling the truth and provides a true macro perspective with forecasts that are uncannily accurate. I eagerly await each month's issues and spend hours reading and studying them. Many times I go back and re-read the most current issue just make sure I did not miss anything the first time!"
(DevM from Virginia)
Edification is not the word that comes to mind when observing an interview with Larry Fink of Blackstone this morning on network financial news. It was inspirational if not humorous, and somewhat pathetic. Of course the interviewer treated him like royalty, when just a syndicate captain, a Made Man. As a cog within the US financial hierarchy, he was asked why Gold is approaching record price levels near $1500 per ounce. He gave his best 10-second answer, showing no depth of comprehension but an excellent grip of propaganda laced with simplistic distortion. He said, "GOLD IS RISING FROM ALL THE GLOBAL INSTABILITY, AND NOT FROM INFLATION AT ALL." Sounds good, but it lacks much reflection of the world of reality burdened by complexity and interconnectivity that the enlightened perceive. At least he did not babble about Gold being in an asset bubble. It cannot, since Gold is money. It is curious that all the analysts, bankers, fund managers, corporate chieftains who did not advise on Gold investment over the last ten years are precisely whom the financial network news appeals to for guidance in the current monster Gold bull run. They knew nothing before, and they know nothing now. The major US news networks carry the Obama water while the USCongressional members carry the USBanker robes and show respect with genuflection before the priests. But guys like Fink are their harlot squires. Poor Ben Bernanke, despite his high priest position, does not gather a fraction of respect that Alan Greenspan did even though Alan presided over the collapse. The wild card possibly later this year or 2012 will be a national movement to force mandatory wage gains, and thus avert a national economic collapse. The squeeze is on in a powerful manner to both businesses and households.
ANOTHER STRONG GOLD BREAKOUT
As long as Quantitative Easing programs are in place and actively pursued, Gold & Silver prices will soar. The programs are urged by exploding budget deficits and absent USTBond demand. That translates to a ruined USDollar currency. Gold & Silver respond to the debasement and ruin. Efforts will become ridiculously stretched to save the USDollar, but will fail. QE will go global and secretive, assuring tremendous additional gains in the Gold & Silver price. No effort to liquidate the big USbanks will occur, thus assuring the process will continue until systemic breakdown then failure. The more extraordinary the measures to save the embattled insolvent fraudulent USDollar, the more the Gold & Silver price will soar. It is that simple. Gold & Silver will soar as long as central banks continue to put monetary inflation machinery to work. They are attempting to provide artificial but coordinated USTreasury Bond demand. In the process their efforts will continue to push the cost structure up further. In my view, since the Japan natural disaster hit with financial fallout, the Global QE is very much in effect, but not recognized as a global phenomenon. It pushes up Gold in uniform fashion worldwide.
50 FACTORS POWERING THE GOLD BULL
- USFed is stuck at 0% for over two years and printing $1.7 trillion in Quantitative Easing, otherwise called monetary hyper inflation. They are not finished destroying both money and capital.
- USFed tripled its balance sheet, with over half of it bonds of exaggerated value, while it gobbled up toxic mortgage bonds as buyer of last resort. The mortgage bonds have turned worthless. The USFed waits for a housing revival to bail itself out, but it will not arrive.
- Debt monetization has gone haywire, as over 70% of USTBond sales from the USFed printing press. The QE was urgently needed, since legitimate buyers vanished. Even the primary dealers have been reimbursed in open market operations within a few weeks.
- PIMCO has shed its entire USTreasury Bond holdings, seeing no value. They joined many foreign creditors in an unannounced buyer boycott in disgusted reaction to QE which is essentially a compulsory unilateral debt writedown.
- Growing USGovt deficits have run over $1.5 trillion annually, with absent cuts, obscene entitlements, endless war. The prevailing short-term 0% interest rates are out of synch with exploding debt supply and rising price inflation.
- Unfunded USGovt liabilities total nearly $100 trillion for medicare, social security, pensions, and more. The obligations are never included in the official debt. It represents insult to injury within insolvency.
- Standard & Poors warned that USGovt could lose AAA rating in lousy credit outlook, one chance in three within the next two years. Ironically, the announcement came on the day when the USGovt exceeded its debt limit. The network news missed it.
- State & Municipal debt have collapsed, as 41 states have huge shortfalls, and four large states are broken. They might receive a federal bailout. It could be called QE3, maybe QE4.
- Coordinated USTBond purchases from Japanese sales have relieved the USFed, as other major central banks act as global monetarist agents. The sales by Japan are vast and growing. Witness the last phase in unwind of Yen Carry Trade, where 0% borrowed Japanese money funded the USTreasury Bonds and US Stocks.
- Quantitative Easing, a catch word for extreme monetary inflation and debt monetization, has become engrained into global central bank policy, soon hidden. It is so controversial and deadly to the global financial structures that it will go hidden, and attempt to avoid the furious anger in feedback by global leaders. This is the most important and powerful of all 50 factors in my view.
- The FedFunds Rate is stuck near 0%, yet the actual CPI is near 10%, for a real rate of interest of minus 9%. Historically a negative real rate of interest has been the primary fuel for a Gold bull. This time the fuel has been applied for a longer period of time, and a bigger negative real rate than ever.
- The USGovt claims to have 8000 tons of Gold in reserve, but it is all in Deep Storage, as in unmined ore bodies. The collateral for the USDollar and USTreasury debt is vacant. It is in raw form like in the Rocky Mountain range or Sierra Nevada range.
- Fast rising food prices, fast rising gasoline prices, and fast rising metals, coffee, sugar, and cotton serve as testament to broad price inflation. So far it has shown up on the cost structure. Either the business sector will vanish from a cost squeeze or pass on higher costs as end product and service price increases.
- The entire world seeks to protect wealth from the ravages of inflation & the American sponsored QE by buying Gold & Silver. The rest of the world can spot price inflation more effectively than the US population. The United States is subjected to the world's broadest and most pervasive propaganda in the industrialized world.
- The European sovereign debt breakdown with high bond yields in PIIGS nations points out the broken debt foundation to the monetary system. The solutions like with Greece in May 2010 were a sham, nothing but a bandaid and cup of elixir. Spain is next to experience major shocks that destabilize all of Europe again, this time much bigger than Greece. The Portuguese Govt debt rises toward 10% on the 10-year yield, while the Greek Govt debt has risen to reach 20% on the 2-year yield.
- Germany is pushing for Southern Europe bank climax in their Euro Central Bank rate hike. Europe will be pushed to crisis this year, orchestrated by the impatient and angry Germans. They have no more appetitive for $300 to $400 billion in annual welfare to the broken nations in Southern Europe.
- Isolation of the USFed and Bank of England and Bank of Japan has come. The small rate hike by the European Central Bank separated them finally. The Anglos with their Japanese lackeys are the only central banks not raising rates. With isolation comes all the earmarks on the path to the Third World.
- The shortage of gold is acute, as 51 million gold bars have been sold forward versus the 11 million held by the COMEX in inventory. Be sure that hundreds of millions of nonexistent fractionalized gold ounces are polluting the system. Word is getting out that the COMEX is empty of precious metals.
- Such extreme Silver shortage has befallen the COMEX that the corrupted metals exchange routinely offers cash settlement in silver with a 25% bonus if a non-disclosure agreement is signed. The practice cannot be kept under wraps, as some hedge funds push for fat returns in under two months holding positions with delivery demanded.
- China has begun grand initiatives to replace its precious metal stockpiles. They are pursuing the Yuan currency to become a global reserve currency. As they build collateral for the Yuan, they are also elevating Silver as reserves asset.
- A global shortage of Gold & Silver has been realized in national mint production. From the United States to Canada to Australia to Germany, shortages exist. Many interruptions will continue amidst the shortages, which feed the publicity.
- The Teddy Roosevelt stockpile of 6 billion Silver ounces was depleted in 2003. He saw the strategic importance of Silver for industrial and military applications. The USEconomy and USMilitary will turn into importers on the global market.
- The betrayal of China by USGovt in Gold & Silver leases is a story coming out slowly. The deal was cut in 1999, associated with Most Favored Nation granted to China. But the Wall Street firms broke the deal, betrayed the Chinese, and angered them into highly motivated action. No longer are the Chinese big steady USTBond buyers, part of the deal also.
- Every single US financial market has been undermined and corrupted from grotesque intervention, constant props, and fraudulent activity. The degradation has occurred under the watchful eyes of compromised regulators. Fraud like the Flash Crash and NYSE front running by Goldman Sachs is protected by the FBI henchmen.
- The USEconomy operates on a global credit card, enabling it to live beyond its means. The USGovt exploits the compulsory foreign extension of credit in USTBonds, by virtue of the USDollar acting as global reserve currency. Foreign nations are compelled to participate but that is changing.
- The USMilitary conducts endless war adventures for syndicate profits. They use the USTreasury Bond as a credit card. The wars cost of $1 billion per day is considered so sacred, that it is off the table in USGovt budget call negotiations, debates, and agreements
- Narcotics funds have proliferated under the USMilitary aegis. The vertically integrated narcotics industry is the primary plank of nation building in Afghanistan. The funds keep the big US banks alive from vast money laundering.
- No big US bank liquidations have occurred, despite their deep insolvency. Any restructure toward recovery would have the liquidations are the first step. The USEconomy is stuck in a deteriorating swamp since the Too Big To Fail mantra prevents the urgent but missing step.
- The unprosecuted multi-$trillion bond fraud over the last decade has harmed the US image, prestige, and leadership. The main perpetrators are the Wall Street bankers and their lieutenants appointed at Fannie Mae and elsewhere. They bankers most culpable remain in charge at the USDept Treasury and other key supporting posts like the FDIC, SEC, and CFTC.
- The ugly daughters Fannie Mae and AIG are forever entombed in the USGovt. They operate as black hole expenses whose fraud must be contained. The costs involved are in the $trillions, all hidden from view like the fraud. Fannie Mae remains the main clearinghouse for several $trillion fraud programs still in operation.
- The US banking system cannot serve as an effective credit engine dispenser, an important function within any modern economy. It is deeply insolvent, and growing more insolvent as the property market sinks lower in valuation. The banks lack reserves, and hide their condition by means of the FASB permission to use fraudulent accounting.
- The big US banks are beneficiary of continuous secret slush fund support from the USGovt and USFed. Their sources and replenishments have been gradually revealed. The TARP Fund event will go down in modern history as the greatest theft the world has ever seen, easily eclipsing the biggest mortgage bond fraud in history.
- The insolvent big US banks continue to sit at the USGovt teat. The vast umbilical cord of banker welfare has not gone away. Goldman Sachs still is in control of the funding machinery.
- The shadow banking system based upon credit derivatives keeps interest rates near 0%. The usury cost of money is artificially low near nothing. As money costs nothing, capital is actively and rapidly destroyed.
- A vast crime syndicate has taken control of the USGovt. A vast crime syndicate has taken control of the USMilitary. A vast crime syndicate has taken control of the USCongress. A vast crime syndicate has taken control of the US press networks.
- A chronic decline of the US housing sector keeps the USEconomy in a grand decline with constant deterioration. With one million bank owned homes in inventory, a huge unsold overhang of supply prevents any recovery of housing prices. Home equity continues to drain, and bank balance sheets continue to erode.
- Over 11 million US homes stand in negative equity. The sum equals to 23.1% of households. They will not participate much in the USEconomy, except when given handouts. They have become downtrodden.
- The USEconomy will not benefit from a export surge. The US industrial base has no critical mass after 30 years of dispatch to the Pacific Rim & China. The industry must contend with rising costs in offset to the falling USDollar, which is cited as providing the mythical benefit. Then can export in droves if they do so at a loss.
- A global revolt against the USDollar is in its third years. The global players work to avoid the US$ usage in trade settlement. Several bilateral swap facilities flourish, mostly with China. If China supplies products, then the Yuan currency will be elevated to global reserve currency.
- Global anger and resentment over three decades has spilled over. The World Bank and IMF have been routinely used by the US bankers to safeguard the USDollar and Anglo banker hegemony. Neither financial agency commands the respect of yesteryear.
- A middle phase has begun in a powerful Global Paradigm Shift. The transfer moves power East where the wealth engines of industry lie, far from the fraudulent banking centers. The next decade will feature the Chinese as bankers, since their war chest contains over $3 trillion.
- The crumbling global monetary system was built on toxic sovereign debt. Legal tender has been nothing more than denominated debt posing as legitimate by legal decree. That is what word FIAT means. The system is gradually breaking in an irreversible manner.
- The global central bank franchise system has been discredited. It is a failure, which is not recognized by the bank leaders still in charge. The stepwise process of ruin continues with a new sector falling every few months. Next might be municipal bonds.
- Witness the final phase of a systemic cycle, as the monetary system has run its course. It is saturated with debt from faulty design. The deception cited in the mainstream media focuses upon the credit cycle which will renew. It will not. It will break of its own weight and lost confidence.
- The recognition has grown substantially that suppression of the Gold price has been the anchor holding fiat system together. The Chinese realize that Gold, when removed, leads to the collapse of the US financial system. They realize it more than the US public. But the syndicate in control of the USGovt understands the concept very well, as they designed the system.
- The institution of a high level global barter system might soon take root. Gold will sit at its central core, providing stability. No deadbeat nations will participate. That includes the United States and several European nations. The barter system will be as effective as elegant.
- The movements spread like wildfire in several US states to reinstitute gold as money. In a few states, led by Utah and Virginia, progress has been made for Gold to satisfy debts, public & private. Consider the movement to be in parallel to the Tenth Amendment movements.
- Anglo bankers have lost control in global banking politics. The phased out G-7 Meeting is evidence. China has wrested control of G-20 Meeting, and has dictated much of its agenda in the last few meetings. The US has been reduced to a diminutive Bernanke and Geithner being ignored in the corner.
- New loud stirrings by Saudi Arabia seek a new security protector. If security is no longer provided by the USMilitary, then the entire defacto Petro-Dollar standard is put at risk. Remove the crude oil sales in USDollars exclusively, and the US sinks into the Third World with a USDollar currency that cannot stand on its own wretched wrecked fundamentals.
- The IMF solution to use SDR basket as global reserve is a final desperate ploy. By fashioning a basket of major currencies in a basket, they attempt to enforce a price fixing regime. It is a hidden FOREX currency exchange rate price fixing gambit that will invite a Gold price advance in uniform manner across the currencies bound together. This ploy is being planned in order to prevent the USDollar from dying a horrible death at the expense of the other major currencies. By that is meant at the expense of the other major economies which would otherwise have to operate at very high exchange rates.
Introduction of a New Nordic Euro currency is near its introduction. The implementation with a Gold component will send Southern European banks into the abyss, marred by default. The new currency has the support from Russia and China, even the Persian Gulf. In my view, it is a USDollar killer. The first nations to institute a new monetary system for banks and commerce will be the survivors. The rest will slide into the darkness of the Third World.
Gold & Silver seem to be the only assets rising in price, an extension of a terrific 2010 decade. The exceptions are farmland and the US Stock market. However, stock valuations are propped by constant and admitted USGovt support. Their efforts are mere attempts to keep pace with the USDollar decline, as stocks merely maintain a constant purchase power.
A hidden overarching hand seeks the global Gold Standard as the bonafide solution. Darwin is at work, but Adam Smith turns a new chapter. The crumbling monetary solution demands a solution. Further investment in the current system assures a devastating decline into the abyss of insolvency and ruin.
THE HAT TRICK LETTER PROFITS IN THE CURRENT CRISIS.
From subscribers and readers:
At least 30 recently on correct forecasts regarding the bailout parade, numerous nationalization deals such as for Fannie Mae and the grand Mortgage Rescue.
"I look forward to your newsletter more than all the rest each month as you seem to have the best grasp of what is going on."
(ScottN in Washington)
"When I initially read your writings, they provoked a wide range of emotions in me from fear and anger to outright laughter. Initially some of your predictions ranged from the ridiculous to impossible. Yet time and again, over the past five years, I have watched with incredulity as they came true. Your analysis contains cogent analysis that benefits from a solid network of private contacts coupled with your scouring of the internet for information."
(PaulM in Missouri)
"Your analysis is absolutely superior to anything available out there. Like no other publication, yours places a premium on telling the truth and provides a true macro perspective with forecasts that are uncannily accurate. I eagerly await each month's issues and spend hours reading and studying them. Many times I go back and re-read the most current issue just make sure I did not miss anything the first time!"
(DevM from Virginia)
Gold Resources

ENORMOUS EXPLORATION POTENTIAL IN THE GOLDEN TRIANGLE OF BRITISH COLUMBIA
Business Summary
Romios Gold Resources Inc. is a Canadian exploration company focused on the acquisition and exploration of precious and base metal prospects.
The Company's Business Plan is to create shareholder value and reduce exploration risk by acquiring projects with a high discovery potential or a known resource with significant expansion potential and located in major mining districts. The execution of this plan has led to the systematic acquisition of nine strategically located gold- copper properties between Nova Gold/Teck Cominco's and Barrick Gold's properties in the prolific Galore Creek area.
The company has completed drilling programs, geophysical surveys, mapping, soil geochemical and metallurgical work on the Newmont Lake property to further expand the known resource.
The Newmont Lake property has an NI 43-101 Inferred resource of 200,000 ounces of gold at 4.3 g/t ton, 6,790,000 lbs of copper at 0.22% and 291,000 ozs. of silver at 6.4 g/t. In 2008, the company carried out an aggressive $4.3 million exploration program at its Newmont Lake and Trek properties and also added 7,289 hectares to its extensive land position in the Galore Creek area. The drilling program at the Trek property led to the discovery of high grade gold- copper breccias and wider zones of porphyry style mineralization.
The company also holds gold exploration properties in Ontario and Nevada and a molybdenum property in Quebec.
Galore Creek
Northwestern British Columbia hosts two of Canada's most significant mineral deposits: Barrick Gold's Eskay Creek Mine and NovaGold/Teck Resources' massive copper-gold-silver Galore Creek Project.
In 2006, NovaGold announced resources of 7.4 million ounces of gold, 117.1 million ounces of silver and 8.5 billion pounds of copper. All mineralized zones remain open to further expansion.
Since late 2004, Romios Gold Resources Inc. has systematically acquired an extensive land position between NovaGold/Teck Resources' and Barrick Gold's properties.
Regional geologic maps published by the BC Ministry of Energy & Mines and property-wide exploration suggests the underlying rocks and mineralization to many of Romios' mineral tenures may be closely related the porphyry copper-gold-silver deposits at NovaGold/Teck Resources' Galore Creek Project. Romios' mineral tenures contain many exposures of surface mineralization; continued exploration and development of the mineral potential on these lands has led to the discovery of several mineralized zones and a substantial rise in asset value.
Romios' Project in the Galore Creek Area consists of 10 properties including options for a total of 25,826 hectares. Our most advanced properties include Trek, Dirk, Newmont Lake, JW and Royce/Porc properties.
Silver increases make no - sense
Gold is up a few percent, along with platinum. Silver is up something like 33% since the end of '10, but gold etc were much less: ONLY Ag is going up like this. Either all the other metals have to follow (and destroy the dollar, US economic system, and cause world war along with it), OR silver's price is OUT OF CONTROL, due to investment/manipulation or whatever. Gold is manipulated also but it's not doing this. Like 1980, it could be a person or bank trying to set something up. The G/S ratio could be part of this, since supposedly "recent historic averages" are more like 50:1-60:1, not 34:1.
So, 1) don't buy into this upswing (it's hard and I almost did it- but so far haven't. Did I lose, or will there be a VERY LARGE CORRECTION, as seen often enough before?)... we likely will see this due to silver's notorious volatility, so I'm not buying- unless everything- all PMs and commodities etc, go the same way, meaning the end of the US, which will pull down the world with it- meaning the end of the world. I believe the dollar will zero, but present PM values (except Ag) don't support this right now. Thus, 2) try to swap Ag for Au. This ratio is so different, and has no real reason, so why not make a swap for something that ISN'T volatile?
All information comes with no guarantee.
Bob Chapman on PP Talk Silver
Global currency devaluation, tight supplies of physical silver (compared to increasing industrial demand), and investor speculation seem like sufficient explanations for silver's rally. Is there any reason to believe all this conspiracy stuff about the government and/or bankers losing control of their silver suppression scheme, resulting in imminent desperate short-covering that will send the silver price "to da moon" and/or bring the entire government and financial system crashing down? [I think not, but maintain an open mind.]
http://www.youtube.com/watch?feature...&v=dNQ-afHVQQ8
http://www.youtube.com/watch?feature...&v=dNQ-afHVQQ8
Saturday, February 5, 2011
Gold Slips As Traders Weigh Jobs Data, Egypt Unrest
Gold prices fell slightly Friday as a mixed U.S. jobs report and continued unease about turmoil in Egypt did little to spur new refuge demand for the precious metal.
The most actively traded gold contract, for April delivery, settled down $4, or 0.3%, at $1,349 an ounce on the Comex division of the New York Mercantile Exchange.
The U.S. economy added 36,000 jobs in January, the Labor Department said Friday, much
The most actively traded gold contract, for April delivery, settled down $4, or 0.3%, at $1,349 an ounce on the Comex division of the New York Mercantile Exchange.
The U.S. economy added 36,000 jobs in January, the Labor Department said Friday, much
Gold retreats on Egypt report, dollar gain
Gold dropped on Friday as the dollar rallied and after an apparently unfounded television report about an announcement from Egypt sparked more speculation President Hosni Mubarak could be stepping down.
But gold remains on track for its first weekly gain in 2011 after U.S. employment rose far less than expected in January, and after Federal Reserve Chairman Ben Bernanke indicated easy monetary policy would stay in the near term.
Tom Pawlicki, precious metals and energy analyst at MF Global, said gold should benefit as a safe haven on fears that unrest in Egypt would spread across the Middle East despite rumors that Mubarak could resign.
"Since the report has come out, it instilled doubt in the market's mind so I don't know how bullish it can be," he said, referring to a possible drop in gold demand should Mubarak step aside now.
Traders said the rumor seemed to stem from a brief report on U.S. television station CNBC, but more than two hours later there was no news on Egyptian TV about any announcements or possible transition of power. There were no reports from other media outlets suggesting any imminent news from Egypt.
U.S. crude oil futures fell sharply as the report set off speculation that protests in Egypt would end soon. Foreign exchange and equities markets had minimal reactions.
Spot gold dropped 0.3 percent to $1,348.59 an ounce by 2:30 p.m. EST (1930 GMT). U.S. gold futures for April delivery fell $3.90 to $1,349.10.
Analysts said that even as U.S. jobs barely grew in January, gold failed to benefit further from the mixed payrolls report, which also showed that the unemployment rate fell to its lowest since April 2009.
"I think the market's confused," Credit Agricole analyst Robin Bhar said. "On the one hand we didn't get any rise to speak of in the payrolls, but we got a big fall in the unemployment rate, and a big gain in the manufacturing sector."
Bullion was also pressured as the dollar rose against the euro on the U.S. jobless number.
Gold is set for its first weekly gain in five weeks, having posted a strong session on Thursday after Bernanke warned that delays in raising the United States' debt limit could have "catastrophic" consequences, indicating monetary policy would stay accommodative.
HEAVY PRESSURE
The precious metal had faced heavy pressure last month, when bullion posted its first monthly decline in six months after signs that the global economy had started the year on a solid footing with easing worries about Europe's debt crisis.
However, the strength of the economic recovery remains a major question mark for gold, analysts said.
"The medium-term factors for gold -- currency debasement, sovereign debt, inflation -- haven't disappeared and will come back to underpin the market," Bhar said. "But at the moment, why buy gold? There are lots of better things to buy."
Asian buyers remained largely absent, with the market quiet in China, Hong Kong and Singapore during the Lunar New Year holiday there and Indian consumers put off fresh buying by Thursday's price volatility.
Gold holdings of exchange-traded funds inched higher, with those of the largest, New York's SPDR Gold Trust, edging up just over two tonnes on Thursday.
Silver gained 0.1 percent to $28.94 an ounce. Holdings of the largest silver ETF, the iShares Silver Trust, fell more than 30 tonnes to their lowest since November on Thursday.
Platinum group metals touched multi-year highs, with platinum reaching its loftiest level since July 2008 at $1,858.50 an ounce and palladium a 10-year peak at $831.
Platinum was later up 0.3 percent at $1,841.24 and palladium down 0.3 percent at $814.47. (Additional reporting by Jan Harvey in London; Editing by Dale Hudson)
Gold ends lower
SAN FRANCISCO (MarketWatch) — Gold futures settled lower Friday, weighed down by expectations Egypt’s president may be getting closer to his resignation, a stronger dollar, and a previous session’s rally that left the metal vulnerable to a price correction ahead of the weekend.
Copper notched a fresh record high, settling at $4.58 a pound. Platinum settled at its best since July 2008.
Gold for April delivery /quotes/comstock/21e!f:gc\h11 (GCH11 1,349, -4.00, -0.30%) /quotes/comstock/21e!f:gc\h11 (GCH11 1,349, -4.00, -0.30%) settled $4 lower, or 0.3%, at $1,349 an ounce on the Comex division of the New York Mercantile Exchange. Gold advanced 0.6% on the week.
The metal dipped in and out of positive territory earlier. It took a definite turn for the worse, however, on reports the U.S. government was pressuring Hosni Mubarak to resign.
“Some geopolitical risk is coming off based on the reports Mubarak may resign,” said Matt Zeman, a trader at LaSalle Futures Group in Chicago.
A stronger dollar and, more broadly, a sense that positive global macroeconomic news may bring a cycle of monetary tightening also made the day tougher for gold, he added.
April gold rallied 1.6% on Thursday, settling at its best since Jan. 19. On the week, the metal
Earlier Friday, the Labor Department reported the unemployment rate fell unexpectedly to 9% in January.
Economists surveyed by MarketWatch had expected an uptick to 9.5% compared to 9.4% in December.
Gold 2011
Gold, Au, has long been prized for its beauty, resistance to chemical attack, and workability. Because it occurs as a native metal, has a relatively low melting point (1063 oC.), and is malleable, early man easily separated it from rock and cast or hammered it into beautiful designs. Gold serves as a monetary reserve and is used in jewelry, scientific apparatus, dentistry, and photographic processes.
Gold crystallizes in the cubic system, forming octahedral and dodecahedral crystals, often distorted into dendritic or leafy growths. Cubic crystals are rare. A soft metal (hardness 2.5-3), gold can be made harder by alloying it with copper, silver, and other metals. Most gold contains some silver. Pure gold is very dense, with a specific gravity of 19.3, decreasing to 15.6 as silver connate increases. Gold is the most malleable and ductile substance known. It can be flattened out to less than .00001 of an inch (less than .000065 cm) and a 1 oz. (28 gram) mass can stretch out to a distance of over 50 miles (75 kilometers). Gold is also one of the most resistant metals. It won't tarnish, discolor, crumble, or be affected by most solvents. This adds on to the uniqueness of this mineral.
The mineral Gold is almost always mixed with a small amount of silver, and sometimes contains traces of copper and iron. A Gold nugget is usually 70 - 90 percent gold, and the remainder mostly silver. The color of pure Gold is bright golden yellow, but the greater the silver content, the whiter the color. Most Gold is mined from ore, containing tiny amounts of Gold in the ore. The ore is brown, iron-stained rock or massive white Quartz. To extract the gold, the ore is crushed, then the gold is separated from the ore by various methods. Gold is less commonly found as nuggets. Nuggets are formed when erosion causes a large piece of Gold to separate from its mother rock, and then gets carried away into a stream or river. The flowing water tumbles the Gold, giving each specimen a distinct shape. The Gold eventually settles at the bottom of the water, and due to its heaviness remains there. Other nuggets also get caught in the same area, forming a placer deposit. An even rarer form of Gold is as crystals, which are cubic, octahedral, and dodecahedral. Even when the Gold occurs in crystals, they are distorted or are almost microscopic. Although Gold is a rare mineral, it has many scattered occurrences. Most of these occurrences usually lack quality and quantity in regard to Gold. However, certain regions contribute greatly to the gold market. Some of the best known Gold producing regions are: California, Colorado, Ontario, Mexico, Australia, Hungary, and South Africa (the largest producer). Some famous American mines include the Empire Mine and Red Ledge Mine in Grass Valley (Nevada County), California. Very nice crystals and crusts have been found near Ouray, Ouray Co., and in Red Mountain Pass, San Juan Co., Colorado. The Hollinger mine, along with other mines in that area of the Porcupine District, have produced large amounts of Gold.
Update by Karl Harrison
(Molecule of the Month for September 2000 )
Wednesday, January 12, 2011
What is Gold?
Gold is a metallic element with the atomic number 79 and the symbol Au. While the name gold comes from an Old English word meaning yellow, the symbol comes from the Latin aurum, which means “shining dawn.”
On the periodic table of elements, gold is found in Group 11, along with silver, copper, and roentgenium, and in Period 6 between platinum and mercury. It is referred to as a “transition metal.” Gold is the most malleable, ductile metal. Described as yellow, gold is one of the so-called precious metals, along with gold and silver.
Known from ancient times — along with mercury, sulfur, copper, silver, lead, and tin — gold was used as early as 6000 B.C. Early use included gold jewelry, for example bracelets and rings, as well as ornamentation. Its malleability means that its early use in any practical items was impossible, so its used was restricted to decoration. The civilizations that employed it included the Egyptians, the Greeks, the Mesopotamians, and the Romans.
Gold is found in both lode deposits and placer deposits, and is naturally uncombined. While the largest deposit is to be found in South Africa, deposits of note are also located in Australia, the former Soviet Union, and a number of western states of the United States, including Arizona in the Southwest; California, Montana, and Washington in the Pacific Northwest, and South Dakota in the Midwest.
Although many people many know gold for its use in jewelry — which is how about 65 percent of it is used, gold has a number of other uses. About 25 percent of gold is used in industrial applications in ceramics, electrical, and electronics applications.
targets charts for 2011
TARGETS / CIBLES


La présente page a été publiée initialement le 2 janvier 2011 et aucune modification ne sera apportée aux graphiques avant la fin de 2011.
My targets for Decmeber 31, 2011, essentially from a technical stand-point.
This page has been initially published Jan. 2, 2011 and the charts will not be modified until year year's end.


Saturday, January 8, 2011
The Falling Dollar And Debt Drives Gold And Silver
The Falling Dollar And Debt Drives Gold And Silver
Rolf Nef
Tell Gold & Silver Fund
6 January 2011
Tell Gold & Silver Fund
6 January 2011
Since August 1971 the US dollar drops in a cycle that created every 8th year a bottom. The first three bottoms - 1979, 1987 and 1995 - are very clear visible, a bit less so the one in 2003. If the dollar follows this cycle, 2011 should be another year with a dollar bottom.
The drop from 1971 to 1979 was much faster than the following downtrend, but which could accelerate again, once the lower trendlines will be broken. The next line (see next graph) is just below the current price followed by another one at 07.8. The lowest one is at around 0.55 to the Swiss Franc, roughly 40% lower.
The chart of the Swiss Franc to the dollar does show a long history what helps to analyse, but economically it is not significant. A better indicator for that is the dollar-index, weighted with participation at the US foreign trade of each currency. But also this chart indicates, that the US currency will break to the down side. One the one hand side got the lower trendline already three times touched and on the other hand side exist a triangle since 2005, which upper and lower trendline got both already three times touched. A decision will fall soon and most likely to the downside, as the last downleg as shown on the daily short term chart from June to November was impulsive, followed by only one month correction.
The formation from 1992 can also be looked at as a head-shoulder with the head in 2001. The distance from the head to the neckline, which is at 80, is 40 and points - deducted from the neckline to the downside - to 40!! Such a move in this year would be a dollar panic. Also one has to put into consideration, that the break through the neckline and the retracement has already happened. Technically the market is very ready for such a move. Is something like that possible and what would be the economic background?
Since the US balance of payment became negative (e.g. negative trade balance, negative current account and negative balance on capital income), 9'000 bio $ have piled up in foreign hands, mainly in Asia. That's a long position and still growing as long as buyers can be found. But these holder could reduce their dollar position and sell partly. Most likely that would lead to a panic, a fast drop. Therefore it is not surprising we see such a heavy propaganda against the Euro. It seems the last weapon for the unavoidable.
That this scenario has a high probability is also due to the fact, that the US economy will not start being very active again. The main reason is the too high debt burden on the private sector. This sector will not start building new debt and becoming economically active. To the contrary, it tries to reduce the debt load.
Gold and Silver
For the dollar we have only a yearly cycle that points for 2011 as a bottom year. For gold we get more precise cycles also for 2011, but pointing for specific months.
Since the gold bull started in 1835, all bull and bear phases until 1968 happened in exact yearly Fibonacci numbers. From 1968 on the market got faster and switched to monthly figures:
- March 1968 to January 1990: 142 months (closed to 144).
- January 1990 to August 1999: 235 months (closed to 233).
- August 1999 plus 144 months would be August 2011.
- October 2006 (end wave 4) plus 55 months would be May 2011.
- June 2003 (start silver bull) plus 8 years point to June 2011.
Where could the prices be? Look at the lower graph with the three simple trendlines. On the one hand side form the two parallel ones (1934 - 1980 and 1968 - 1999) the channel since 1934. It would be only normal to reach the upper trendline, but which is around $7,000! Even that is very hard to imagine this year -- and I am not willing to do a forecast, the line is still up there. But one has to know that and take into consideration and not rule out as impossible.
On the other hand side forms the trendline from the top in 1869 connected with the top in 1980 the upper line of a rising wedge. Rising wedges are normally negative and drop to the downside, but in commodities very often they go the other way round and are very powerful. I think this is the case here.
More clearer than gold shows the silver chart, that it is in the second upleg of its bull move that started in 1932. Before the third upleg can start, a correction must lie in between, but this will start much higher up, as the high of 1980 is even not yet surpassed, as it is the case with must commodities. And even despite the fact that there is less silver around than in 1980 and much less than in 1900. Today the amount of silver stock is only about 1 bio oz but was 12 bio oz in 1900!! That's why the silver market is only about 1% of the gold market or 30 bio $ relative to 3000 bio $. But it used to be about 30 - 40%.
Even here the technicals point to an explosive future of the silver market. During the fast move from September 2010, the market produced not one gap. This phase is still ahead of us. Despite the scarcity of silver, its relative price to gold is still 1:46 and therefore cheap. Will it fall clearly below 46, it will trade at a level no more reached since 27 years (1983). And something more you get out of this chart: when the gold bull started in March 1968, gold moved faster than gold as silver had its move before, the ratio was around 1:16. But also at the top in January 1980, the ratio was still at 1:16. But now, in front of the parabolic phase, the ratio is still 1:46.
That's why silver is so promising in that phase:
- Extreme scarcity with only 1% of the gold market and only 30 bio $ capitalization
- Short positions in the market
- No large government holdings
- Still cheap relative to gold
- Not yet any gap in the chart
The Princeton Cycle of Martin Armstrong
Because the dollar cycle points to 2011 as a bottom and the Fibonacci cycles for gold point to summer 2011 as a top, I would like to point your attention on the 8,6 year cycle of Martin Armstrong, which points for June 13th as a potential turn. How is that cycle calculated? Armstrong discovered this cycle - 8,6 years are exactly 1000 Phi days. Added to 1928,75, the exact date of the crash, or fractions of it as �, � and 1/8 you get dates which represent very significant market actions:
1987,8: the stock market crash in the US and most other countries.
1989,55: Nikkei top.
1998,55: top stockmarkets followed by the Asia crisis.
2002,85: end of US stockmarket bear from 2000.
2008,225: top commodities and dollar bottom.
2011,45 ?? (also nothing is possible).
All three cycles - each independent from the other - deliver no guarantee - but raise the probability that gold and silver will interrupt the bull move to complete the middle leg. After a pause they will go on even more extreme. Such a final leg is always steep and explosive. The fundamentals will confirm the rising market: bankruptcies and a falling dollar.
********
The Strategy of the Tell Gold & Silver Fund
It has been the strategy of the "Tell Gold & Silver Fund" from the beginning on to target the parabolic phase of the silver market. Because it is so cheap and scarce, this phase must become above average what has happened until now in history. As this phase is still ahead of us and probably closed, the fund keeps a large position of silver call options and the rest in physical. The leverage with options avoids a margin call during hefty corrections or interventions. But the fund can also reverse its position to short or to 100% cash.
How High Can Stocks Go?
How High Can Stocks Go?
7 January 2011
While this analysis is based on the S&P 500 Index, it indirectly applies to all economic expansion and inflation-protection assets, such as copper, oil, silver, and gold. If stocks are making higher highs, inflation-protection assets will most likely come along for the ride.
We study the S&P 500 since it remains the most widely-accepted vehicle to monitor market participants' acceptance of or aversion to risk. Similarly, the S&P 500 helps us monitor the ongoing battle between global inflationary and deflationary forces. When money printing and economic expansion rule the day, the S&P 500 tends to be healthy. When excessive levels of global debt, unfunded entitlements, bloated housing inventories, and economic weakness are front and center, the S&P 500 tends to be weak.
As we outlined in our 2011 Investment Outlook, the S&P 500 recently cleared several key levels, which leaves the door open to the possibility of higher highs in stocks. This analysis looks at market levels that piqued the interest of both buyers and sellers between 1998 and 2011. We studied weekly and monthly charts looking at intra-day highs and lows, as well as closing prices. The table below summarizes the results, focusing on market levels that have the highest probability of impacting asset prices.
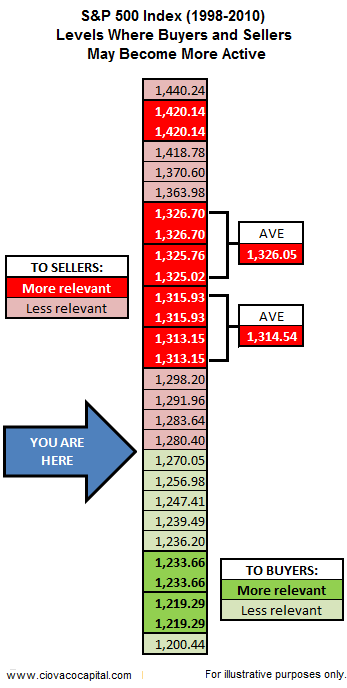
The chart below highlights important levels from a monthly perspective. There are numerous ways to determine possible areas of support and resistance. Therefore, other levels may, and most likely will, come into play over the coming months.
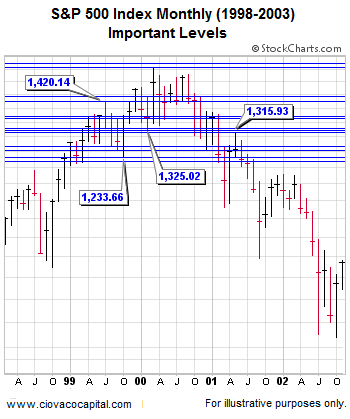
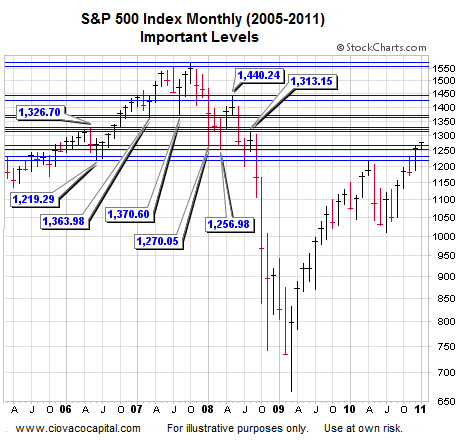
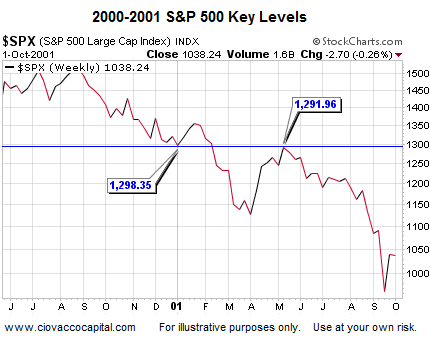
The same concept is presented below with a different time frame. Notice on the right side of the chart, the present day market may have some more room to run in terms of the most relevant levels of resistance.
The following charts are weekly charts identifying key S&P 500 levels in a little more detail than shown in the summary table above. If you bookmark this article, it may be helpful to check back from time-to-time as the market advances or declines.
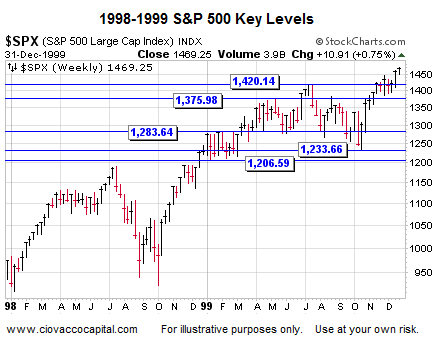
While not all that important since they marked relatively short reversals, the S&P 500 does have to contend with 1,275.09 and 1,279.64 in the short-run (see below).
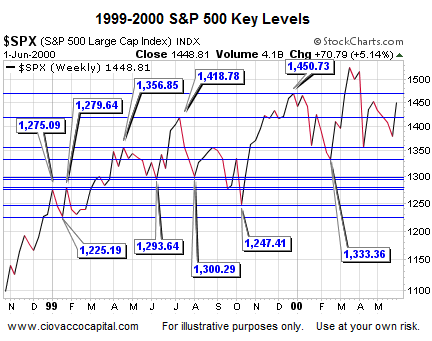
The chart above looks at closing prices. The chart below is based on intra-day highs and lows. All three are relevant to market participants.
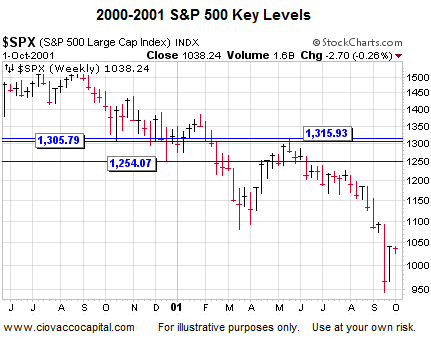
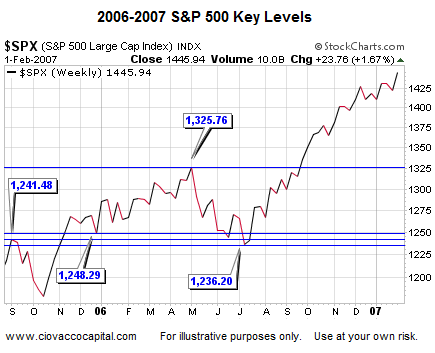
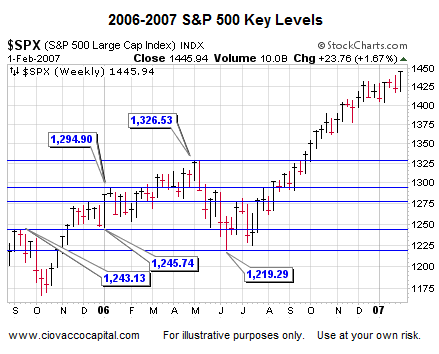
The analysis above can help both bulls and bears alike since it identifies areas of possible support should market participants begin to refocus their attention on the deflationary side of the coin. The market's upside potential, even under positive circumstances, may not be met until some form of corrective activity or consolidation takes place. Bullish sentiment needs to be monitored and remains a yellow flag for the markets.
The S&P 500 & Gold Under Pressure on Friday
With the holiday season in the rear view mirror and volume slowly creeping back into the marketplace, I can't help but wonder what lies ahead. The optimist in me is hopeful that the economy will continue to repair itself and the financial issues that plague the federal government, state government, and local governments will just go away as the economy rebounds. The only problem with my hope is that massive debts and deficits do not simply disappear and I fear the problem will be a long and lasting one.
Federal Reserve chairman Ben Bernanke indicated that unemployment numbers are likely to remain stubbornly high for an extended period of time. He also made it clear that Quantitative Easing II was necessary and needed to be continued in a vain attempt to keep interest rates low. Since its inception, treasury rates have done nothing but increase which begs the question whether the program is really doing anything it was intended to do.
In addition to our domestic debt issues, unemployment claims, and poor housing market we find that the crisis in Europe while somewhat muted, continues to manifest in a negative fashion. Nearly every where we look we are surrounded by fundamental issues which directly impact risk assets. These issues have been constant for quite some time and the S&P 500 has shrugged them off and powered higher. The S&P 500 has put on quite a run since the March 2009 lows, and while we have had several corrections and a "flash crash" along the way, we have yet to see a major correction turn into bearish market conditions.
Is price action today an early warning sign that lower prices await us in the equities market. Is the U.S. Dollar going to breakout above the 50 period moving average and challenge the 83 price level on the weekly chart?
LBMA Survey: Gold Prices To Average $1,457 Per Ounce In 2011
(Kitco News) - Gold prices are forecast to average $1,457 an ounce during 2011, a 19% increase over the 2010 average, according to an annual survey of analysts released by the London Bullion Market Association Friday.
Analysts collectively predicted silver will average $29.88 an ounce, which would be a 48% increase on the 2010 average price.
The 2011 average platinum price was forecast at $1,813, a rise of 12.6% from the 2010 average. For palladium, the 2011 prediction was $814.65, a 54.8% increase from the 2010 average.
Twenty-four analysts took part in the LBMA survey, listing their estimates for the high, low and average prices for the precious metals in 2011, based on London fixings.
The average gold forecast of $1,457 is in line with the forecast of $1,450 made by delegates to the 2010 LBMA Precious Metals Conference held in Berlin in September.
For gold, the average 2011 high forecast for the year was $1,632 and the average low was $1,268. The comparable figures for silver were $38.36 and $22.93.
For platinum, the average high forecast for the year was $2,015 and the average low was $1,598. The comparable figures for palladium were $993.35 and $631.17.
Default I Got my Scale !
Hello,
Through some great advice here I purchased my 1st scale to confirm 1 ounce gold coins. I did not realized that gold is measured by "troy" ounces which less than a US ounce! Still learning about this stuff. I've got all the different weights for a one troy ounce.
1 troy ounce of gold.
1.10 US ounce,
31.10 grams,
480 grains and
155.5 carrots.
Question: How much does the weights in all measurements have to be off before I start questioning if the gold coin is a fake? I would not what to falsely
tell a seller a one ounce coin is counterfeit, when it might not be.
Thank you in advance!
Nehemiah
Jim Sinclair's $1650 By 1-14-2011 Tribute Thread
With this board being the Internet's most popular gold forum, I feel it's appropriate to honor Jim Sinclair's decade long prediction that spot gold will trade at $1650 on or before January 14th, 2011 so that members can add their congratulations when that number is achieved some time before next Friday's close.
The price is currently just $280 away from the target number which equates to a rise of less than 21% for his magnum opus call to hit.
Uncle Jim, as he is affectionately known by many, remained steadfast throughout 2010 when reaffirming his call at regular intervals. He always did so using statements that left no room for any ambiguity and they served to reassure his readers and admirers to retain their trust in him.
He stiffened their resolve once again a little over five weeks ago on December 2nd and by doing so his ten-year-old call became a six weeks one too. Those remarks and other recent ones are quoted and linked below.
December 2nd, 2010 - 'Be assured that the gold price will be looking back at all levels including $1,400, $1,500 and $1,600 in the very near future. http://jsmineset.com/2010/12/02/in-the-news-today-724/
September 7th, 2010 - 'I will stand with what I have said for nearly 10 years. Gold will trade at $1650 on or before January 14th, 2011.' http://jsmineset.com/2010/09/07/stra...-the-big-move/
July 27th, 2010 - 'The timing remains the same. Gold will trade at $1650 on or before January 14th 2011.' http://jsmineset.com/2010/07/27/jims-mailbox-497/
July 6th, 2010 - 'Gold is going to $1650 on or before January 14th, 2011.' http://jsmineset.com/2010/07/06/time-and-time-again/
June 8th, 2010 - I know for certainty that gold will trade at $1650 on or before Jan 14th, 2011. http://jsmineset.com/2010/06/08/in-the-news-today-566/
Alchemical Gold
A small thread for the few who may wish to discuss the esoteric side, that is to say, the alchemical and representational values of gold.
Two "starter" observations as 2011 unfolds:
(1) Owning gold is a beginning. The real gold, worthy of possession at any price, is an undivided mind. Which is simple enough: he or she who does not violate his or her conscience is a golden fellow. Others must go into denial, which is two-mindedness--insanity from the angelic point of view.
(2) I had figured that the early a.m. January 4th eclipse of the Sun would be favorable for gold, unfavorable for the dollar. Obviously I got it backwards (as I thought I might). It was a North Node eclipse in the second house (Washington D.C. reference place), exactly opposite the US Sun.
My question for anyone practicing the ancient art of cycles is, did I get the interpretation reversed because (a) the nodality (North Node) overrode the aspectuality (opposition to the Sun = dollars or gold), because (b) the eclipse ocurred in the U.S. second house (presumably dollar positive on a North Node eclipse), or (c) for some other reason?
Subscribe to:
Posts (Atom)